July 17, 2018
Regulations for Alternate Chart Reading Technology
By Rui Wang – President, Cenozon
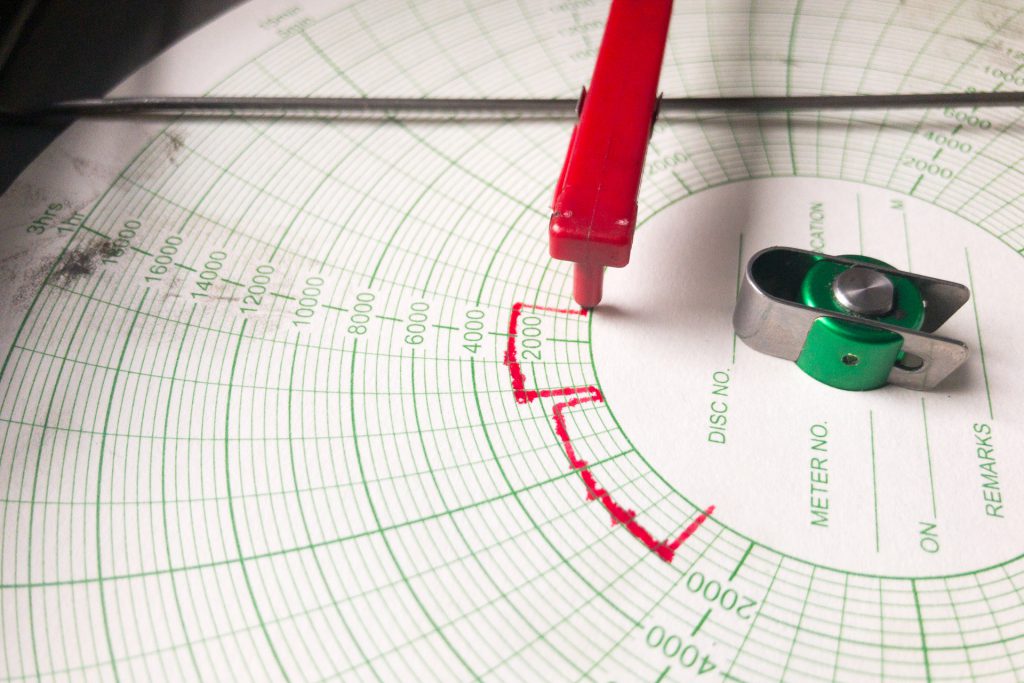
Alberta Energy Regulator’s (AER) Directive 17 specifies the measurement requirements for oil and gas operations. Meters measure the volumes of fluid that pass through pipelines. As hydrocarbons move through the orifice, its readings are recorded on circular charts using a planimeter. These charts can then be read to determine total fluid volumes in a certain period.
Directive 17’s clause 4.3.9.5 specifies the possibility of using alternate chart reading technology. It specifically mentions the use of digital scanning technology. Operators using such a technology do not need any prior approval from the AER, although they need to meet certain conditions for using such technology.
The alternate digital scanning technology that operators use need to be equal or be better than the previous manner of reading charts. The chart scans need to be repeated three times at 120 degrees rotation to ensure sufficient accuracy of the results. AER expects accuracy levels of +/- 0.5%.
Furthermore, the original charts need to be retained for 12 months. During AER audits, the scanned images of the charts must be made available to AER. They allow this to be done through a cloud solution.
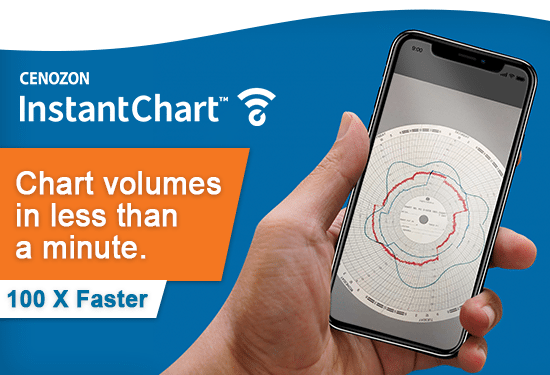
Cenozon’s InstantChart fits perfectly with the terms of AER’ s Directive 17 regarding the use of alternate scanning methods. It uses a mobile device to take a photo of the chart. The photo is processed and the lines on the chart are segmented and extracted using image processing. Inferences from the photo are drawn from the processed image through computer vision techniques. The meter flow volumes are determined within minutes. All the meter chart photos are kept in secure storage in the cloud from where AER auditors can have access to them from anywhere.